—
Active Listings
—
Avg. Home Price
—
Avg. Days on Market
—
NL Communities
Loading current MLS® properties…
—
Active Listings
—
Avg. Home Price
—
Avg. Days on Market
—
NL Communities
Loading current MLS® properties…
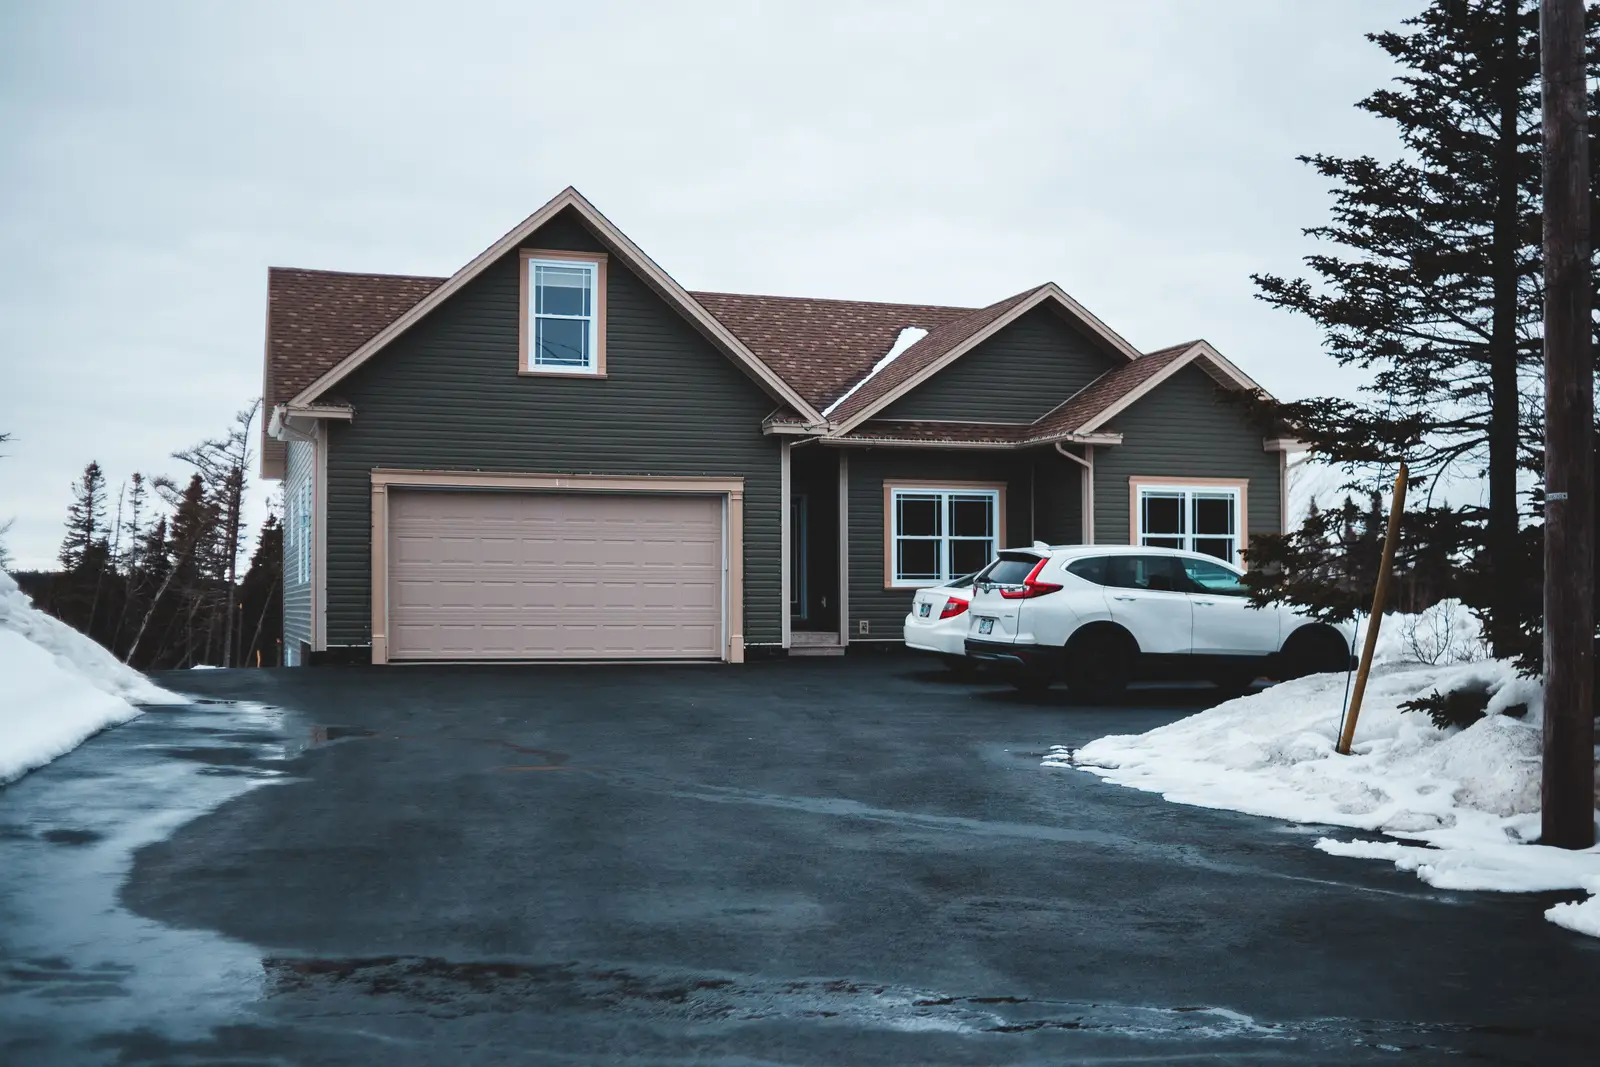
MLS® sold data
1,262 recorded sales since 1988, in Placentia, Whitbourne, Ocean Pond, Dunville and nearby, each with its own page.
Placentia & St. Mary's · 12 months to October 2026
80
Recorded sales
40 days
Median days on market
41%
Sold within 30 days
1,682 sq ft
Median floor area
How many homes sold in Placentia & St. Mary's each year, from the first recorded sale to the latest.
| Year | Sales | Median days on market |
|---|---|---|
| 2026 to date | 72 | 38 |
| 2025 | 88 | 54 |
| 2024 | 78 | 60 |
| 2023 | 75 | 70 |
| 2022 | 79 | 62 |
| 2021 | 98 | 70 |
| 2020 | 64 | 79 |
| 2019 | 50 | 82 |
| 2018 | 41 | 66 |
| 2017 | 53 | 75 |
| 2016 | 38 | 73 |
| 2015 | 45 | 83 |
| 2014 | 37 | 63 |
| 2013 | 48 | 82 |
| 2012 | 51 | 71 |
| 2011 | 35 | 88 |
| 2010 | 33 | 40 |
| 2009 | 30 | 54 |
| 2008 | 23 | 132 |
| 2007 | 40 | 99 |
| 2006 | 26 | 118 |
| 2005 | 34 | 93 |
| 2004 | 22 | 100 |
| 2003 | 13 | 101 |
| 2002 | 15 | 109 |
| 2001 | 10 | 72 |
| 2000 | 12 | 92 |
| 1999 | 4 | 99 |
| 1998 | 5 | 82 |
| 1997 | 9 | 78 |
| 1996 | 11 | 60 |
| 1995 | 3 | 143 |
| 1994 | 3 | 75 |
| 1993 | 0 | — |
| 1992 | 4 | 96 |
| 1991 | 5 | 91 |
| 1990 | 3 | 49 |
| 1989 | 4 | 189 |
| 1988 | 1 | 58 |
| Home type | Last 12 months | Typical days | Since 1988 |
|---|---|---|---|
| Single-family homes | 66 | 38 | 1,026 |
| Two-apartment homes | 1 | 89 | 27 |
| Mobile & mini homes | 0 | — | 7 |
| Multi-family buildings | 0 | — | 4 |
| Cottages & recreational properties | 13 | 42 | 188 |
| Other residential | 0 | — | 10 |
| Quarter | Sales | Median days |
|---|---|---|
| 2024 Q4 | 15 | 65 |
| 2025 Q1 | 11 | 85 |
| 2025 Q2 | 25 | 64 |
| 2025 Q3 | 32 | 42 |
| 2025 Q4 | 20 | 59 |
| 2026 Q1 | 21 | 45 |
| 2026 Q2 | 27 | 40 |
| 2026 Q3 | 23 | 29 |
Choose a town for every recorded sale there.
Source: MLS® System sold records, contracts dated December 1988 to October 2026. Dates are estimated contract dates. Figures are believed accurate but not guaranteed. Sold prices are not published.
Sign in to see days on market
Days on market and listing dates from the MLS® System are available to registered members. A free account takes a minute. For prices and what happened to a home, ask Felix directly.
| Address | Type | Beds | Baths | Sq ft | Off market | Days on market |
|---|---|---|---|---|---|---|
| 4 Point Verde RoadPoint Verde | Single-family home | 4 | 1 full, 1 half | 1,320 | June 2024 | Members only |
| 0 Lighthouse RoadPoint Verde | Cottage / recreational property | 1 | 1 half | 310 | February 2023 | Members only |
| 3 Willes LanePoint Verde | Single-family home | 3 | 2 | 1,862 | October 2019 | Members only |
| 20 Cape Shore HighwayPoint Verde | Single-family home | 2 | 1 | 2,400 | March 2017 | Members only |
| 0 Main RoadPoint Verde | Single-family home | 3 | 1 full, 1 half | 940 | July 2016 | Members only |
| 16 Main RoadPoint Verde | Single-family home | 2 | 1 | 868 | April 2013 | Members only |
| 0 Main RoadPoint Verde | Single-family home | 3 | 1 full, 1 half | 1,540 | September 2011 | Members only |
| 0 Brownes LanePoint Verde | Single-family home | 3 | 1 full, 1 half | 2,580 | May 2009 | Members only |
| 0 Point VerdePoint Verde | Single-family home | 3 | 2 | 1,480 | September 2007 | Members only |